|
GEOG 332 - Analytical Exercise
For larger versions of photos, click on image.
Introduction Why do over 17 million people live in Southern California? One of the most common answers to this question is that the region has such a wonderful climate. Climate is the aggregate of day-to-day weather conditions over a long period of time. It is what you "expect" the weather to be like at a given time of year. Because the regions we explore in this class are expressions of human-environment interaction, the climatic characteristics of an area help us interpret the distribution of people and the ways they live. This exercise will help you better understand the forces and processes that create the pattern of climates in the United States and Canada.
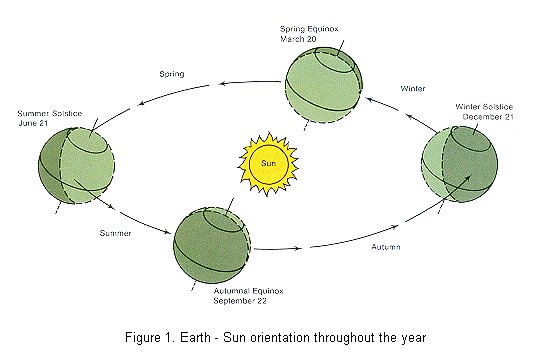
Climatic Controls Nearly all energy in the earth’s ecosystem originates from the sun in the form of solar radiation. Solar energy that reaches the earth is called insolation. Most solar energy that reaches the earth does not heat the atmosphere directly. Instead, it passes through the atmosphere and heats the earth’s surface. The earth’s surface then heats the atmosphere from below. Because the earth is nearly spherical, energy from the sun does not heat all areas equally. Regions near the equator, where the sun’s rays are nearly perpendicular to the earth’s surface, receive more intense solar radiation. As one moves toward the poles, the suns rays hit the earth at an angle, reducing its intensity. Latitude, therefore, determines the amount of insolation an area might absorb. This is complicated by the fact that the earth’s axis of rotation is tilted 23 ½ degrees relative to the plane of its orbit around the sun. Furthermore, the axis always points in the same general direction in the universe regardless of where the earth is in its orbit. (See Figure 1). This means that in addition to receiving different amounts of solar radiation across the surface of the earth because of latitude, the place that receives the most intense solar energy changes throughout the year. It is the transfer of energy from the sun from the places that receive the most to those that receive the least that drives the earth’s climatic systems. As you can surmise from Figure 1, areas in the Northern Hemisphere receive more intense solar radiation in the summer than in the winter. And for any given time of year areas further north receive less intense solar radiation than those further south. One would be tempted to claim that places in the north are always colder than places in the south. However, another important climatic control, continentality, modifies the influence of latitude. Continentality refers to the tendency for land to heat and cool more rapidly than water. Places far from large water bodies will experience greater seasonal temperature extremes. That is, they tend to get colder in the winter and warmer in the summer than places nearer to large water bodies that experience a maritime influence. The difference between the average summer high and average winter low is termed annual temperature range and it tends to be greatest in areas with greater continentality. As you can imagine, proximity to large water bodies also tends to influence precipitation levels as well. In most cases, areas located near large water bodies will have greater precipitation due to the increased moisture in the atmosphere that has evaporated from the nearby water. But what about places like "sunny" Southern California? We live near the ocean, but we receive very little precipitation. The temperature of the water body is also important. The water off the coast of Southern California is relatively cold creating a stable air mass that inhibits precipitation. In order to understand how this works we need to understand how precipitation occurs. As you know, water exists on earth in all three states of matter, solid (ice), liquid (water), and gas (water vapor). When gaseous water (water vapor) in the atmosphere changes state to a liquid or solid and falls to the earth as rain, snow, sleet, or hail it is called precipitation. In order to make water vapor change to liquid water; the air must be cooled somehow. The only mechanism by which large quantities of air are cooled sufficiently to cause precipitation is called adiabatic cooling. As air rises through the atmosphere, it expands because it is subject to less pressure from the weight of overlying air. This expansion of the air causes it to cool. Therefore, in order to cause precipitation, moisture laden air needs to rise, expand, and cool.
How do you get air to rise? In the atmosphere, four mechanisms can cause air to rise. These are orographic uplift, localized heating, convergence and mid-latitude cyclones.
A few words about atmospheric pressure and wind We briefly alluded to the concept of atmospheric pressure earlier, but we need to understand it better before we discuss the other two mechanisms that cause air masses to rise, and cool. Atmospheric pressure can be thought of as the weight of the air above a location. Generally, winds blow from areas of high pressure to areas of low pressure. Areas, or cells, of high pressure are associated with subsiding (downward moving) air which inhibits precipitation. Low pressure cells are associated with rising air and often produce precipitation. What about air masses? If an air mass lingers in an area for a long enough period of time, the air will take on the temperature and moisture characteristics of that region. For example if the air sits over a warm water body for long enough, the air will become warm and moist. Air masses are classified based on their region of origin. The temperature of an air mass is based on its latitude of origin either tropical (T) or polar (P). The moisture content of an air mass is associated with the surface over which it formed. If it formed over land, it is dry and referred to as continental (c). If it formed over a water body, it is called maritime (m) and is moist. We can designate four major air mass types that affect North America using the following two-letter codes.
You have a map of air masses and their source regions that was distributed in class and in your textbook. It is useful to refer to it when reading this section. As indicated earlier, there is a distinct seasonal change in the amount of solar radiation received at the Earth's surface. The movement of air masses is related to this change. During the winter, the polar air masses (cP and mP) are able to migrate southward from their regions of origin and dominate the weather in the United States. Continental polar (cP) air descends from northern Canada bringing cold dry conditions to the Midwest, East Coast, and Southern States. Continental Polar (cP) air rarely migrates to the Western States because of the large mountain barriers and the prevailing winds which tend to drive weather patterns toward the east. When a cP air mass sneaks through and makes its way to Southern California, we experience extremely cold (often sub-freezing) conditions and the weather folks get excited about an "Arctic Express." Maritime Polar air (mP) originates over the cold north Pacific Ocean and migrates toward the east bringing cool temperatures and lots of moisture. When this moist air mass encounters a mountain range we get orographic precipitation as discussed above. Often these mP air masses carry sufficient moisture to make it all the way across the mountains of the West. When they do, they are responsible for most of the winter snow storms that strike the Midwest. Another mP air mass forms over the north Atlantic Ocean. However, since the prevailing winds drive weather to the east, this air mass rarely affects North America. Occasionally, there is a reversal of air flow and a "northeaster" brings cold temperatures, wind, and rain or snow to New England and the Maritime Provinces. In the summer, the Tropical air masses (cT and mT) dominate the climate in North America. Maritime Tropical (mT) air from the Gulf of Mexico and subtropical Atlantic Ocean has a substantial impact on the weather of the eastern United States. As this hot and very humid mT air moves over the hotter land, localized heating can cause massive thunderstorms. The summer weather in the eastern half of the country is generally hot and muggy. Hot, dry Continental Tropical (cT) air can form over the southwestern deserts in the summer bringing high temperatures and clear skies to the region. During the spring and fall, the pattern of air masses is shifting
and considerable conflict occurs as one air mass displaces another.
Because air masses of different temperature have different density,
they do not mix readily. The boundary between two air masses is called
a front. If a warm air mass is moving into an area the
boundary is called a warm front and looks like this
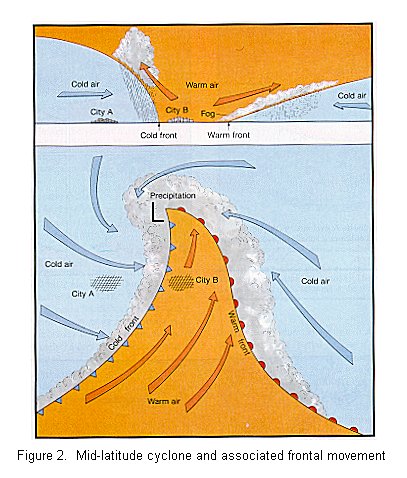
The other two mechanism that will cause air masses to rise. The first two mechanisms that will cause air to rise in the atmosphere were orographic uplift and localized heating. The last two are convergence and Mid-latitude cyclones. Convergence If a region is experiencing low atmospheric pressure, then air from surrounding higher pressure areas will flow into the region. As the air flows into the region from all directions, it will be forced to rise.
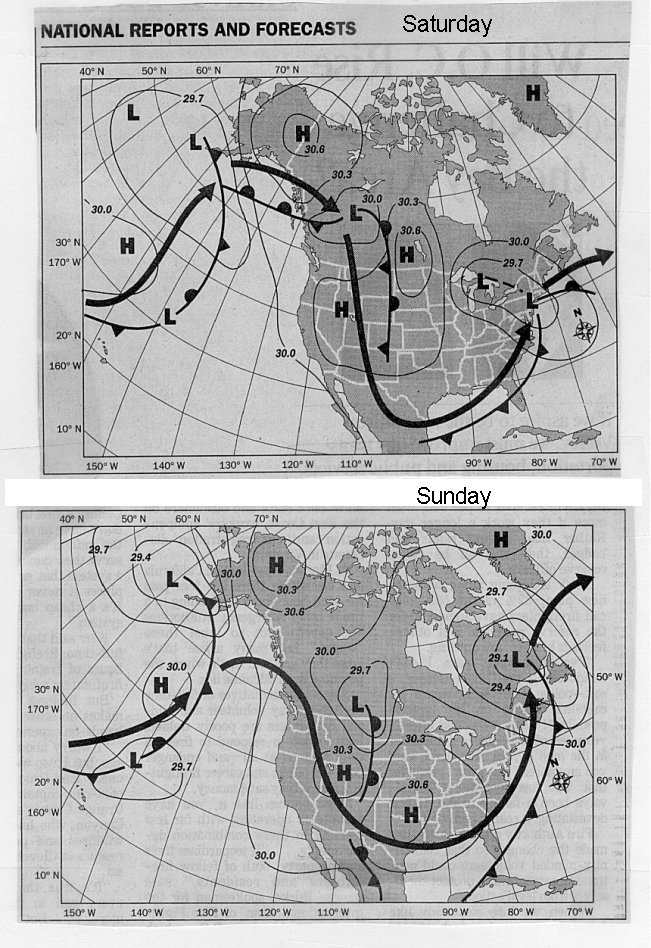
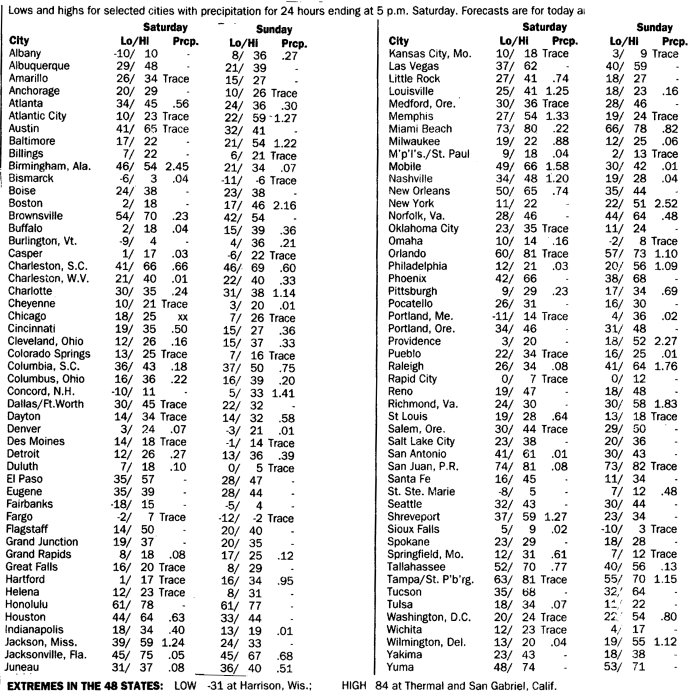
That was interesting! Now what? Instructions and Detailed Questions Submit your responses to the following questions in the form of a brief report entitled, "Climatic Variability." That typewritten packet does not need to repeat the detailed questions. A simple numbering of your responses will be adequate. Some may be answered with just a few numbers or a brief phrase. Others will require a paragraph or two of explanations. Do not submit the original data set or these instructions. No special covers or binders, please. 1. Long term climatic averages for both temperature and precipitation are shown on Table 1 for a sampling of eighteen cities in the United States. Use that data to answer the following questions: Now consider the maps and data which display conditions for two periods in January. The first set of maps and data is for Saturday and Sunday, January 2nd - 3rd. You need the maps for these dates and the data. The second set is for January 14th. 2. What took place across the Upper Midwest on Saturday? What happened further east along mid-Atlantic states? Contrast Sunday's high temperatures in St. Louis and Oklahoma City with the high in Anchorage, Alaska . . . discuss these temperature differences and explain what caused that unexpected picture?
4. The last section of this exercise entails weather monitoring and interpretation of the major controls which determine weather conditions over a short-term period, such as a single week in time. Use a U.S. Map that shows latitude and longitude (here is one you might use as a guide, but it does not have cities) to select two cities for which you will track weather conditions over at least a four-day sequence. Split the United States into four quadrants, with the dividing boundaries being 40 degrees N. latitude and 90 degrees W. longitude. Pick any two major cities from different quadrants. The only restrictions are that you cannot use places located in California, Florida, Alaska, or Hawaii. (For example, New York City and Phoenix could represent the Northeast and the Southwest, respectively.) You only need two cities total, but I want them to be from different areas of the country (i.e. different quadrants). Once you have chosen your "favorite cities" go to the Internet web site http://www.wunderground.com to obtain your data for a minimum four (4) day span and monitor conditions in each city. It is very important that you check your cities as closely as possible to the same time each day --- noon or mid-afternoon are usually very good times; early morning or late evening generally do not reveal as much about representative daily conditions. You were shown is class how to collect this data, but if you run into difficulties, please contact your professor. Some other useful weather sites on the Internet include weather.com and accuweather.com. a. Prepare a Summary Weather Table which displays the following conditions for each of your two cities at the time of your reading:

Again, if you have any questions or concerns regarding this exercise, please contact your instructor:
Last Modified: 09/04/24 |